Are you tracking demand generation metrics that don’t actually predict pipeline success?
Most marketing teams drown in vanity metrics while missing the five critical demand generation metrics that determine true impact. Marketing gets viewed as a cost center instead of a profit driver. Sales blames marketing for poor lead quality while marketing can’t prove their pipeline contribution.
The reality is that successful demand generation teams focus on just five demand generation metrics that directly correlate with pipeline generation and revenue growth. These demand generation metrics create accountability between marketing and sales while building the data foundation for predictable revenue growth.
This guide reveals the exact demand generation metrics that separate high performing programs from budget draining activities.
Table of Contents
- Cost per Inquiry
- Cost per Marketing Qualified Lead
- INQ to MQL Conversion Rate
- Cost per Sales Qualified Opportunity
- MQL to SQO Conversion Rate
1. Cost per Inquiry
Track the true cost of generating initial interest in your solution.
Cost per Inquiry represents one of the most fundamental demand generation metrics for building predictable revenue engines. This demand generation metrics foundation shows your marketing spend divided by total inquiries generated. Therefore this core demand generation metrics calculation helps optimize both aggregate performance and individual channel effectiveness.
Paid media channels that use AI for Google Ads and AI for Meta Ads provide the most predictable Cost per Inquiry tracking. Content syndication, paid search, paid social, and display advertising offer clear spend to inquiry ratios. Meanwhile inbound channels require attribution tools like Bizible for accurate measurement. However the investment provides essential visibility into true acquisition costs.
Cost per Inquiry varies based on channel type, competition levels, targeting precision, and offer strength. Furthermore remember that an inquiry represents initial interest, not sales readiness. The prospect expressed interest in solving a problem but isn’t ready for sales conversations yet.
Key factors affecting Cost per Inquiry:
- Channel type (explicit versus contextual targeting)
- Market competition levels
- Targeting precision and audience quality
- Offer relevance and perceived value
2. Cost per Marketing Qualified Lead
Generate qualified leads that actually convert to opportunities and revenue.
Cost per MQL ranks among the most critical demand generation metrics for program success. This essential demand generation metrics measurement separates successful programs from failed experiments. Additionally low cost MQLs that convert to opportunities create the foundation for predictable revenue growth through effective demand generation metrics tracking.
Lead scoring models typically determine MQL status by ranking prospects based on sales readiness signals. These signals include lead source, behavioral scoring, and predictive analytics. Furthermore your Cost per MQL directly reflects both channel performance and how well your nurturing process moves inquiries toward meaningful actions.
Direct MQL sources include high commitment assets like free trials, demo requests, and use case specific content. These self qualifying prospects often cost more per lead but convert at higher rates to opportunities and closed deals. Moreover B2B Cost per MQL typically ranges from $150 to $900 depending on annual contract value.
SaaS companies see variation based on monthly recurring revenue versus annual contract models. Therefore higher ACV businesses can justify premium Cost per MQL investments for channels that deliver existing demand.
Key MQL optimization factors:
- Lead scoring accuracy and threshold settings
- Nurturing content quality and relevance
- Channel intent level and audience qualification
- Offer value perception and commitment level
3. INQ to MQL Conversion Rate
Measure the quality of your top of funnel marketing activities.
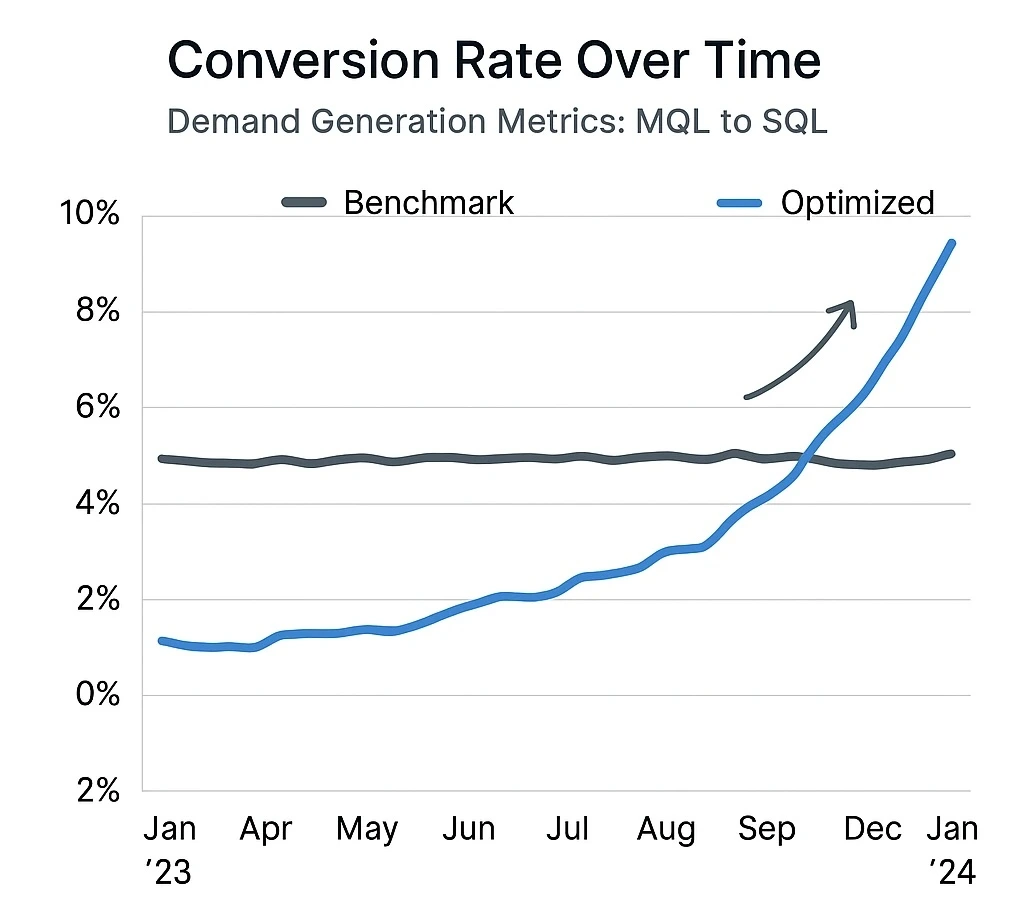
INQ to MQL conversion rate reveals whether your targeting and offers actually resonate with qualified prospects. Low conversion rates indicate gaps between audience targeting and offer correlation. Otherwise lead scoring criteria doesn’t surface real demand as marketing qualified leads.
The benchmark INQ to MQL conversion rate across B2B demand generation metrics is 10%. Programs below this demand generation metrics threshold need channel level analysis to identify conversion blockers. Therefore successful demand generation metrics optimization requires drilling down into each channel driving inquiries to pinpoint improvement opportunities.
Low INQ to MQL conversion typically stems from poor targeting criteria. Additionally assets don’t provide enough value to advance buyers. Furthermore wrong messaging for the audience or combinations of these factors create conversion problems.
High performing programs align targeting precision with offer value and clear next step calls to action. Moreover optimizing this conversion rate improves the efficiency of your entire demand generation funnel. Every percentage point improvement in INQ to MQL conversion reduces your effective Cost per MQL while increasing pipeline volume from the same marketing investment.
Common conversion rate killers:
- Broad targeting that attracts unqualified traffic
- Generic content that doesn’t address specific pain points
- Weak calls to action that don’t encourage progression
- Lead scoring models that misidentify sales readiness
4. Cost per Sales Qualified Opportunity
Calculate the total investment required to generate qualified sales opportunities.
Cost per SQO measures your complete marketing investment divided by sales qualified opportunities created. This metric shows the true cost of generating prospects that meet BANT requirements. Additionally these prospects display genuine purchase intention in the near future.
Sales Qualified Opportunities represent marketing qualified leads that SDRs or BDRs successfully advance to sales executives for initial meetings. These meetings explore prospect pain points while educating about viable business outcomes. Furthermore each SQO stage predicts future pipeline performance and quota achievement.
Sophisticated demand generation programs use reliable MQL to SQO conversion rates to predict pipeline stages and opportunity volume. The total accounts in pipeline plus average deal size provides leading indicators for quarterly booking performance against targets. Moreover understanding Cost per SQO enables profitable campaign decisions by showing maximum MQL acquisition costs while maintaining positive return on advertising spend.
This measurement transforms marketing from cost center to profit driver by demonstrating clear pipeline contribution. Therefore effective Cost per SQO tracking requires alignment between marketing and sales teams on qualification criteria and opportunity definitions.
SQO optimization strategies:
- Improve MQL quality through better lead scoring
- Enhance SDR follow up sequences and timing
- Align marketing content with sales conversation needs
- Track opportunity progression and identify bottlenecks
5. MQL to SQO Conversion Rate
Measure how effectively marketing qualified leads become sales opportunities.
MQL to SQO conversion rate calculates total sales qualified opportunities divided by total marketing qualified leads. This metric reveals whether your lead qualification process actually identifies sales ready prospects. Otherwise it generates false positives that waste sales resources.
The benchmark MQL to SQO conversion rate across B2B demand generation is 30%. Programs below this threshold typically suffer from lead scoring models that qualify prospects too quickly before they’re actually ready for sales engagement. Moreover low MQL to SQO conversion also indicates inside sales teams struggle to convert qualified leads into opportunities.
This requires reworking follow up sequences, reducing SLA response times for hot MQLs. Additionally improving sales and marketing alignment around qualification criteria becomes essential. High performing conversion rates require tight collaboration between marketing and sales teams.
Marketing must understand what makes prospects sales ready while sales provides feedback on lead quality and conversion barriers. Therefore successful programs create regular feedback loops and shared success metrics between teams.
Conversion rate improvement tactics:
- Calibrate lead scoring thresholds based on sales feedback
- Implement faster response times for high intent MQLs
- Create sales enablement content for common objections
- Establish regular marketing and sales alignment meetings
Your Demand Generation Metrics Implementation Strategy
Don’t track every possible demand generation metrics simultaneously.
Start with Cost per Inquiry and INQ to MQL conversion rate to establish your demand generation metrics foundation. These core demand generation metrics reveal whether your top of funnel activities generate qualified interest efficiently. Focus optimization efforts on channels that deliver both volume and quality in your demand generation metrics analysis.
Add Cost per MQL and MQL to SQO conversion rate once you have reliable inquiry generation through your demand generation metrics tracking. These advanced demand generation metrics show whether your nurturing process effectively qualifies prospects for sales engagement.
Implement Cost per SQO tracking when you have predictable MQL generation. This ultimate demand generation metrics measurement demonstrates marketing’s direct pipeline contribution and enables accurate ROI calculations through comprehensive demand generation metrics analysis.
The future belongs to demand generation teams who prove pipeline impact through data driven demand generation metrics. Start with these five demand generation metrics, optimize relentlessly, and scale what drives predictable revenue growth for your business.